Debugging PHP in an alpine docker container
Don’t we all have that annoying buggy app that should be fixed but works just enough to not do it right now? Well, for me that was my Bookstack wiki that took around 3 sec for every page load. So I will share what I learned and how I fixed it.
1. Step: Safari Console
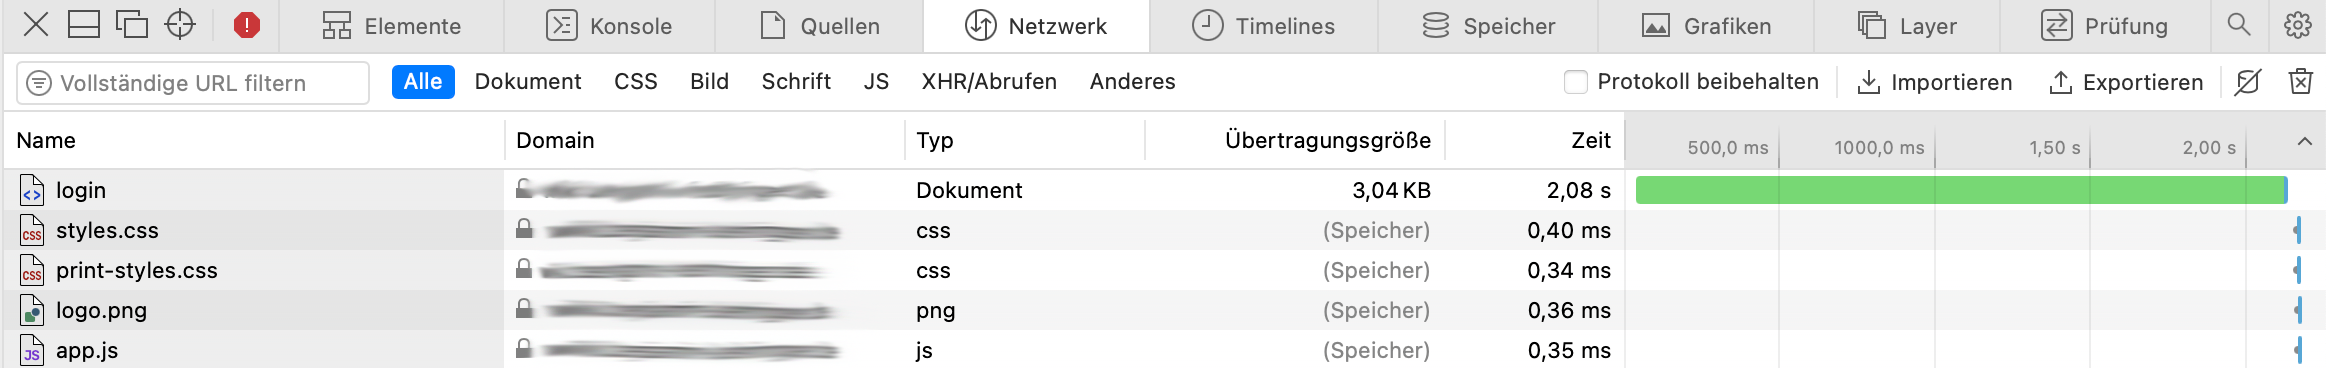
My first guess was that something is wrong with my machine but looking at the debug console of Safari it seems like the request takes the host a long time to complete while the connection is established very fast and other requests complete very fast as well.
2. Step: Is it the proxy?
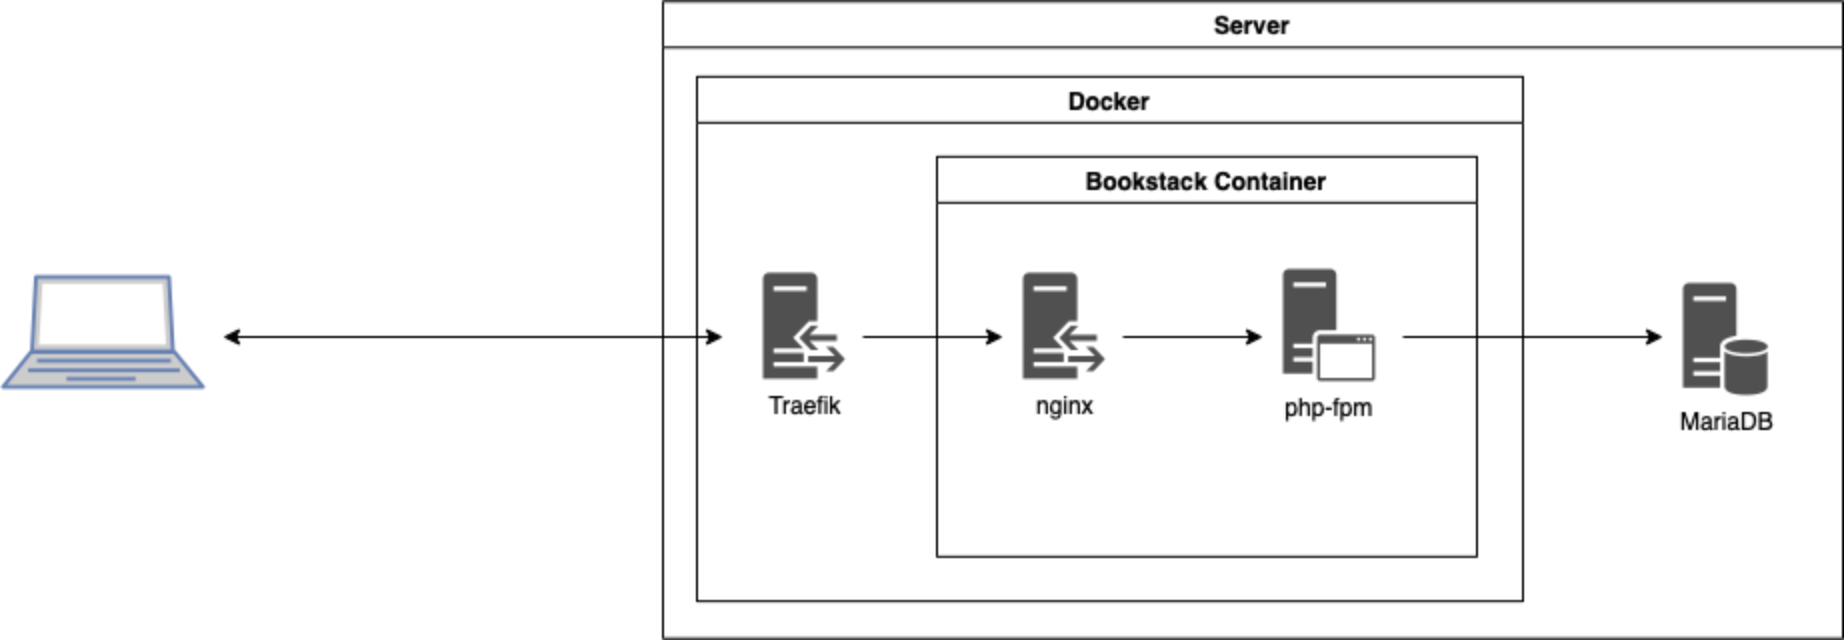
Now, Bookstack runs on my own server in a docker container behind a traefik reverse proxy. Yes, there are quite some indirections. To make it clearer, I graphed it:
The traefik logs aren’t very helpful, but nginx in the Bookstack container can ouput timing information.
Getting timing ouptut from nginx logs
To get timing information from Nignx without relying on nginx Plus or Amplify, you can alter the access log messages. In my case I first have to get a shell in the docker container that runs Bookstack:
# The container name is 'bookstack' |
Then, building on a nginx blog post, define a log format in the http config section and give it a name, in this case apm:
# In http config section |
Finally, go to the server block of the site you want to get access logs from and add an access log statement with a log file path and the format name you created earlier:
# In site config (server) section |
You can find more information on the variables and log format in the nginx documentation.
Analyzing nginx timing output
The access request log for the request shown above in the Safari debug console looks like this:
"20/Dec/2021:22:53:32 +0000" client=172.200.0.2 method=GET request="GET /login HTTP/1.1" request_length=1233 status=200 bytes_sent=3609 body_bytes_sent=2203 referer=- user_agent="Mozilla/5.0 (Macintosh; Intel Mac OS X |
Interestingly, the overall request time (request_time) is almost as long as the one shown in the browser. So the problem seems to lie in the PHP app. Establishing the connection to the php-fpm server (upstream_connect_time) is also very fast. The bulk of the waiting happens when nginx is waiting for an answer from php-fpm (upstream_header_time).
3. Step: What’s so slow in the PHP app?
So the slow part is the PHP app. That’s quite inconvenient, as it’s running in an alpine docker container on a remote server. To look into the timing of the PHP app we need some profiling output, but the libraries for that are not included in the container.
Installing xDebug in an Alpine docker container
To get profiling data from PHP we will use Xdebug. Unfortunately it’s not included in the PHP packages of the linuxserver/bookstack container which is based on alpine, so we have to install it by hand:
# We need some dependencies |
We also have to configure PHP to use Xdebug. There should be a ini file somewhere named like 99_xdebug.ini in your PHP config folder. Modify it like this:
root@f2e9891aa0f1:/# cat /etc/php7/conf.d/50_xdebug.ini |
You can then test wether Xdebug is active by placing a small PHP file into the www root. If you get a green page with a lot of information when calling it from your browser, Xdebug is working.
|
Analyzing traces with QCacheGrind
After getting the trace out of the docker container with docker cp and scp, I analyze the trace with QCacheGrind on MacOS, installed from homebrew. After clicking around a bit in the call stacks, I found this:
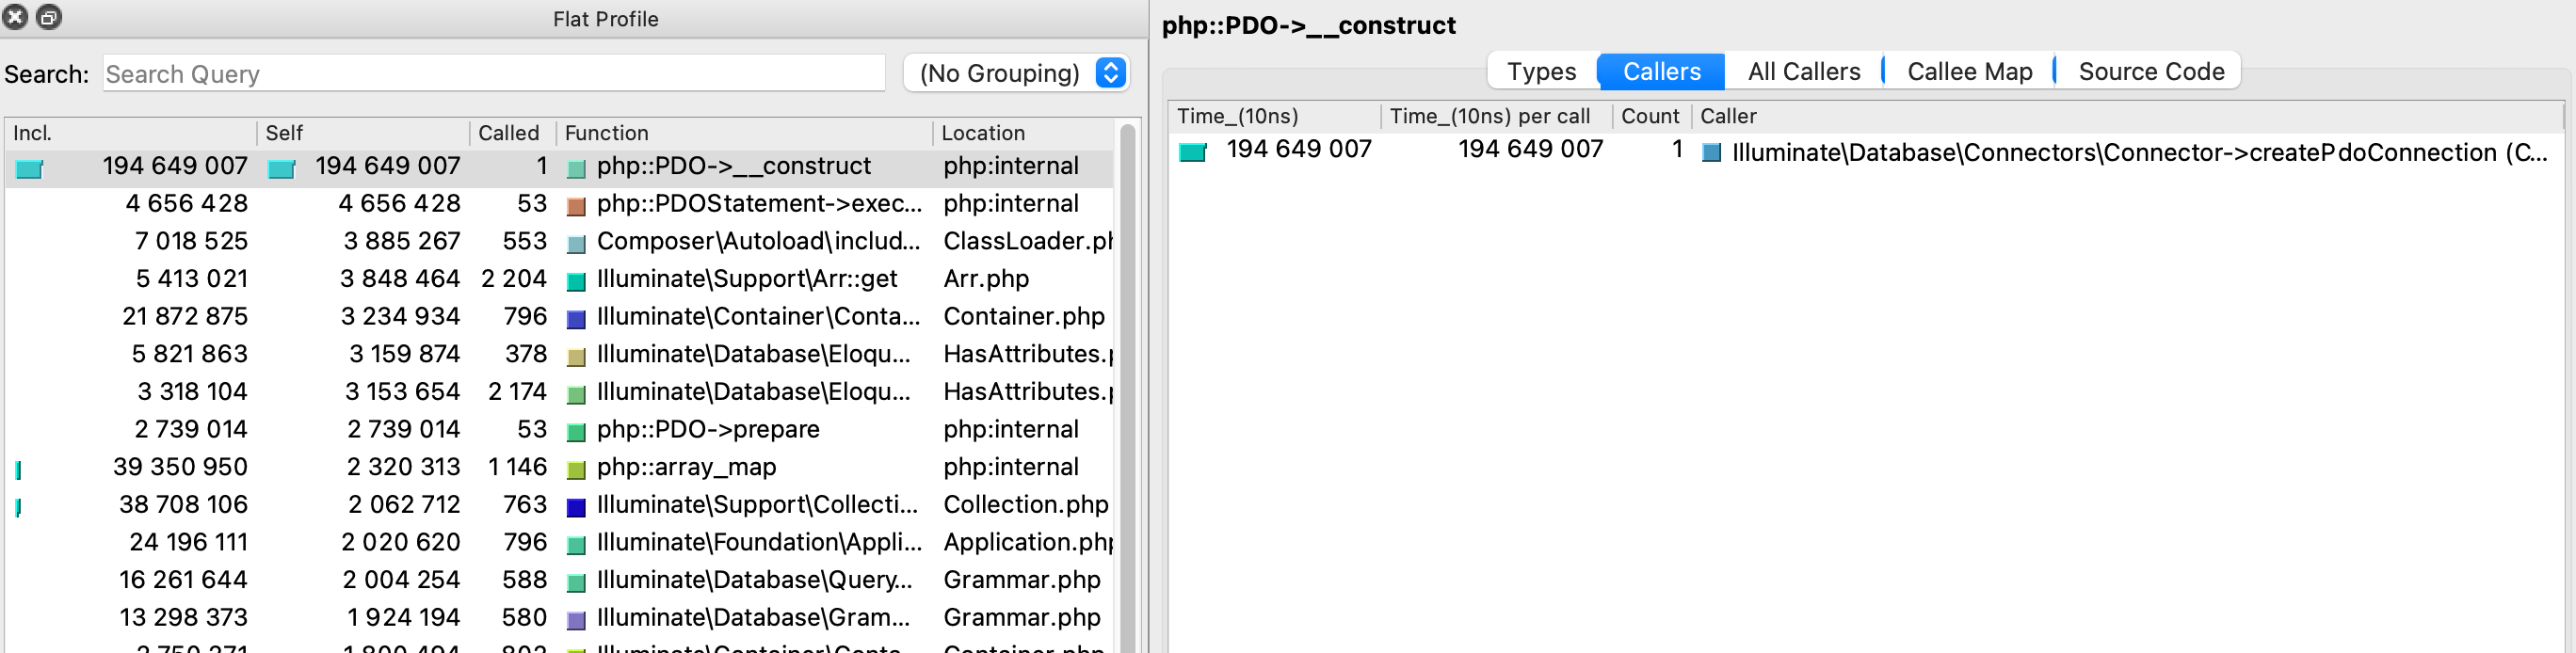
Apparently establishing a connection to the MariaDB SQL server makes up 2/3 of the whole request processing time.
Solution: mariadb config on docker bridges
After googling around a little, I found the solution: MariaDB tries to do a reverse DNS lookup when Bookstack connects. But my MariaDB instance is not running in a container but on the host. There, it has no access to the name resolution of docker. So, the DNS lookup times out which explains the wait time.
There might be more elegant solutions to this problem, but I chose to just disable this reverse lookup behaviour entirely:
[mysqld] |
And yes, permissions based on hostnames will not work anymore now in MariaDB. But I don’t use those anyway.
After recreating the container to get rid of all the mess I made, my request times went from around 3 seconds to 300 milliseconds. Usable…
Lesson learned 1: Log4j is not the only one doing lookups in weird places
At least it’s not while adding data to a HashTable.
Lesson learned 2: PHP profiling may be not that helpful
If you did pay attention, you have noticed that establishing the db connection made up 2/3 of the request time, but after all my requests improved 10 fold. The discrepancy is due to the overhead Xdebug introduces to PHP processing. So profiling this way is obviously useful to find large single calls, but if your performance is suffering from multiple slightly longer calls, you will have a hard time figuring that out with Xdebug.