When running more and more machines it becomes impractical to check on each of them by logging in and going through the numbers yourself. This is especially true for a variable number of machines like in cloud scale sets.
So what can we do? Prometheus is a popular solution to collect and store metrics from your machines. You can then browse them either via its included web interface or third party apps like Grafana.

In this post we will look at a practical example of metric collection with Prometheus on Microsoft Azure scale sets. I assume that you already have an Azure deployment set up. If not, check out my post on Microsoft Azure VM deployment.

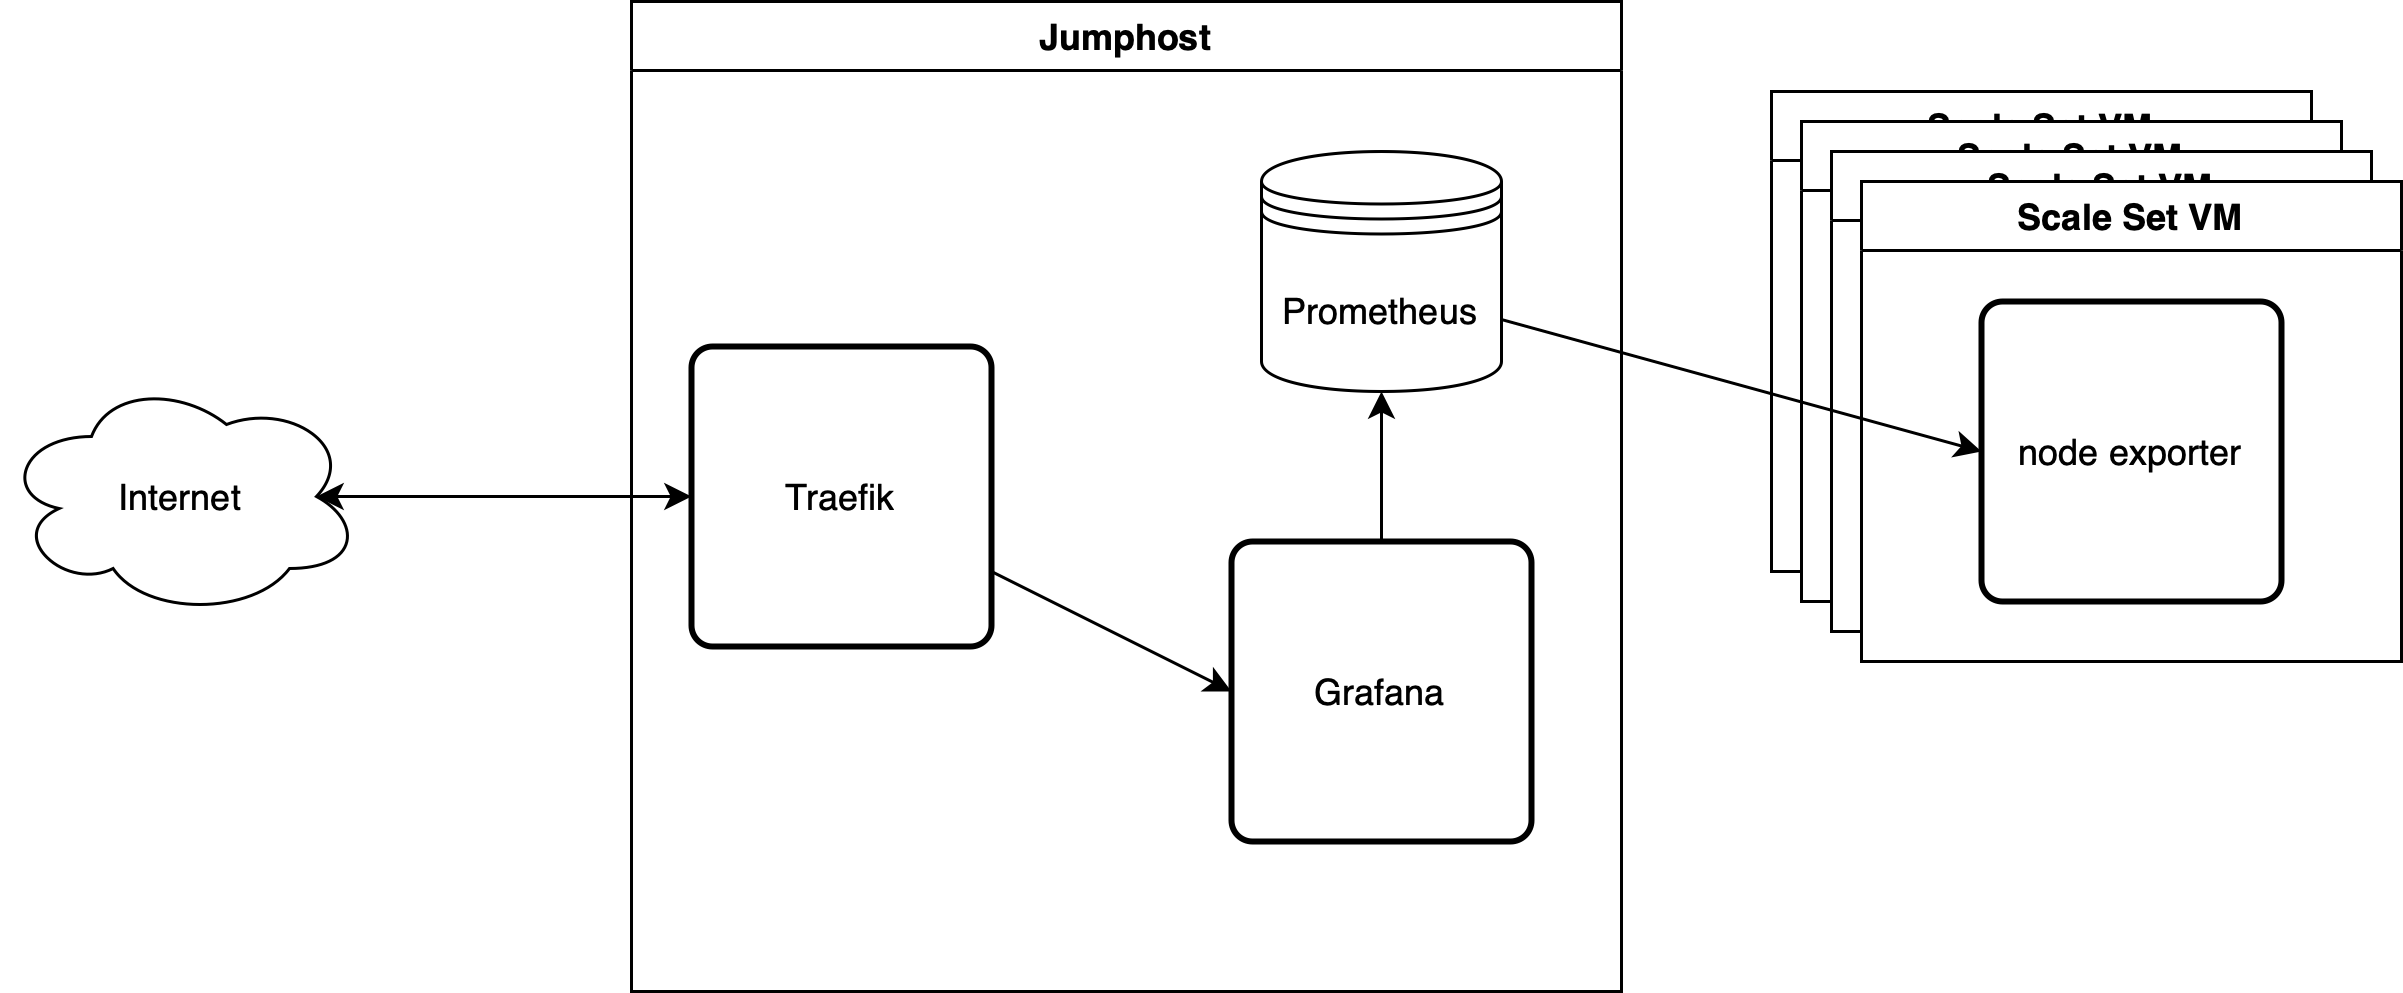
We will run Prometheus in a docker container on a jumphost VM utilizing the also present Traefik. I got a post about how to set up Traefik with Ansible on your jumphost if you need it. Prometheus will then fetch the metrics from a small exporter app on each of the Azure scale set VMs. Finally, we display the data with Grafana that also runs in a container on the jumphost.

Export Metrics from Scale Set VMs

Prometheus relies on other apps called ‘exporters’ to make metrics availabe for various sources. Prometheus can collect metrics on just about anything, as long as they are served in a common format. There are various exporters for metrics from different kinds of systems: Linux, MySQL, Jira, and many others. You can also write your own exporter. To get information about system utilization we will use a metrics exporter called ‘node_exporter’.

There is a ready made node_exporter package on Ubuntu that we will install on our image.

Prepare an Azure Image with Prometheus Node Exporter

Like in Monero Mining on Azure we use Packer to build and store an image on Microsoft Azure. Check out their tutorials page for further documentation. Our demo image will be rather minimal and do nothing except exporting metrics.

image/node_exporter_image.pkr.hclview raw
# import the Azure credentials from the environment (export them before building the image)
variable "azure_client_id" {
default = env("AZURE_CLIENT_ID")
}

variable "azure_subscription_id" {
default = env("AZURE_SUBSCRIPTION_ID")
}

variable "azure_secret" {
default = env("AZURE_SECRET")
}

# tell packer to use the Azure plugin
packer {
required_plugins {
azure = {
version = ">= 1.0.0"
source = "github.com/hashicorp/azure"
}
}
}

source "azure-arm" "node_exporter_image" {
client_id = "${var.azure_client_id}"
subscription_id = "${var.azure_subscription_id}"
client_secret = "${var.azure_secret}"

# the image has to go into the same resource group as the scale set
managed_image_resource_group_name = "tnglab"
managed_image_name = "node_exporter_test"

os_type = "Linux"
image_publisher = "Canonical"
image_offer = "0001-com-ubuntu-server-jammy"
image_sku = "22_04-lts-gen2"

# adjust location to your needs
location = "West Europe"
# sufficient for building the image
vm_size = "Standard_B2s"
}

# build the image
build {
name = "xmrig-build"
sources = [
"source.azure-arm.node_exporter_image"
]

provisioner "shell" {
environment_vars = [
]
inline = [
# the Ubuntu cloud image does some magic on boot. Wait for that to finish
"cloud-init status --wait"
# first, update the package index
"sudo apt update",
# now install the node_exporter
"sudo apt install -y prometheus-node-exporter",
]
}
}

To build the image, just:

# Use "force" to overwrite an existing image
packer build -force node_exporter_image.pkr.hcl

If you need a newer Ubuntu base image you can get a list from the command line using Microsofts Azure tool:

az vm image list -l northcentralus -p Canonical --all -s 22_04

But beware: Packer 1.8.0 has SSH issues with Ubuntu 22.04. Ubuntu 21.10 works for me, 22.04 does not.

Start a Microsoft Azure Scale Set with Ansible

You can start an Azure Scale Set with just one ansible task if you already have a resource group, virtual network and subnet. I got a post on how to create your Azure virtual network and subnet.

---
- name: Start Node Exporter Test VMs on Azure
hosts: localhost
gather_facts: no
connection: local
tasks:
- name: Ensure VM scale set
azure_rm_virtualmachinescaleset:
name: tnglab-node-exporters
resource_group: tnglab
# Pick your chosen size
vm_size: Standard_D2as_v4
# How many VMs you want in the scale set
capacity: 3
virtual_network_name: tnglab-vnet
subnet_name: tnglab-subnet
upgrade_policy: Manual
admin_username: azureadmin
ssh_password_enabled: no
ssh_public_keys:
- path: /home/azureadmin/.ssh/authorized_keys
key_data: ssh-rsa AAAA... benjamin@tnglab
managed_disk_type: Standard_LRS
# Here we reference our image from above
image:
name: node_exporter_test
resource_group: tnglab
...

Now you have some VMs running in the cloud, exporting metrics. Let’s collect that metrics.

Collecting Metrics with Prometheus

Prometheus will collect and store our metrics. We start a Prometheus container on the jumphost and provide a config file that specifies how to reach the scale set VMs. We use Traefik to make the web interface available from the outside. Traefik will read the labels of the docker container and act accordingly. Now you may wonder why we expose the data store to the internet. Well, it’s very useful for debugging. Prometheus exposes its own web interface with which you can browse the collected data and check on the status of the scrape jobs.

The ansible task simply copies the config and starts the container. We tell Traefik to put a basic auth in front of the web interface. It’s exposed to the web, after all.

roles/prometheus/tasks/main.ymlview raw
---
- name: Include prometheus vars
include_vars:
dir: vars

- name: Ensure directories
file:
name: "{{ item }}"
state: directory
loop:
- "{{ prometheus_config_directory }}"

- name: Copy config
template:
src: files/prometheus.yml.j2
dest: "{{ prometheus_config_directory }}/prometheus.yml"
register: prometheus_config

- name: Ensure prometheus container
docker_container:
name: prometheus
image: prom/prometheus:v2.33.3
command:
- "--config.file=/etc/prometheus/prometheus.yml"
- "--storage.tsdb.path=/prometheus"
- "--web.console.libraries=/usr/share/prometheus/console_libraries"
- "--web.console.templates=/usr/share/prometheus/consoles"
- "--web.external-url=https://{{ ansible_host }}/prometheus"
networks:
# This should be the subnet that traefik is on, too
- name: internal
volumes:
- "{{ prometheus_config_directory }}:/etc/prometheus"
restart_policy: unless-stopped
restart: "{{ prometheus_config.changed }}"
labels:
# Traefik will read these labels and route the traffic accordingly
traefik.http.routers.prometheus.rule: "Host(`{{ ansible_host }}`) && PathPrefix(`/prometheus`)"
traefik.http.routers.prometheus.entrypoints: "websecure"
traefik.http.routers.prometheus.tls: "true"
traefik.http.routers.prometheus.middlewares: prometheus-compression,prometheus-auth
traefik.http.services.prometheus.loadbalancer.server.port: "9090"
traefik.http.middlewares.prometheus-compression.compress: "true"
# Traefik will be exposed to the internet. So we use basic auth to secure it
traefik.http.middlewares.prometheus-auth.basicauth.users: "{{ prometheus_basic_auth_username }}:{{ prometheus_basic_auth_htpassword }}"
traefik.http.middlewares.prometheus-auth.basicauth.removeheader: "true"
...

We store our variables in the vars/main.yml as always, and the secrets in a vault file that we can encrypt later. This way we can still search for the variables while also be able to safely commit them to a repository.

roles/prometheus/vars/main.ymlview raw
---
prometheus_config_directory: /srv/data/prometheus/config
prometheus_basic_auth_username: "{{ vault_prometheus_basic_auth_username }}"
prometheus_basic_auth_password: "{{ vault_prometheus_basic_auth_password }}"
prometheus_basic_auth_htpassword: "{{ vault_prometheus_basic_auth_htpassword }}"
azure_client_id: "{{ vault_azure_client_id }}"
azure_subscription_id: "{{ vault_azure_subscription_id }}"
azure_tenant: "{{ vault_azure_tenant }}"
azure_secret: "{{ vault_azure_secret }}"
...

We store the password for basic auth in the vault so that we can later use it in other recipies. But Traefik reads the password in Apache format. You can create a string like this:

htpasswd -n promuser
# then enter the password, you will get something like this:
promuser:$apr1$uWyPQU4W$qO9F.2Sx2e2p/eNvm7exp.
# everything after the ":" is the encrypted password that Traefik needs
roles/prometheus/vars/vault.ymlview raw
---

vault_prometheus_basic_auth_username: promuser
# you should seriously change this password
vault_prometheus_basic_auth_password: bar
vault_prometheus_basic_auth_htpassword: $apr1$uWyPQU4W$qO9F.2Sx2e2p/eNvm7exp.
# fill these
vault_azure_client_id: ...
vault_azure_subscription_id: ...
vault_azure_tenant: ...
vault_azure_secret: ...
...

In the Prometheus config file we specify the Microsoft Azure account data from where Prometheus shall collect metrics. Prometheus would then try to collect metrics from all machines in the subscription. If you want to narrow it down, you can provide a resource group identifier.

roles/prometheus/files/prometheus.yml.j2view raw
---
global:
scrape_interval: 15s
evaluation_interval: 15s

scrape_configs:
- job_name: "scalesetvms"
# Not very secure, but it's an internal network
scheme: http

azure_sd_configs:
- subscription_id: "{{ azure_subscription_id }}"
tenant_id: "{{ azure_tenant }}"
client_id: "{{ azure_client_id }}"
client_secret: "{{ azure_secret }}"

# Only collect from VMs in resource group tnglab
resource_group: tnglab
# Collect on port 9100
port: 9100
...

Ok, now prometheus will collect metrics from your VMs. Let’s prepare Grafana…

Provision Grafana Datasources

We could manually add the Prometheus container as a datasource in Grafana, but this is not the way. Instead we provision the Prometheus datasource when we set up Grafana. That won’t require huge changes. We just have to copy a configuration file to the right directory.

Our Grafana ansible task then sets up the config directories, copies the config files and starts the grafana container:

roles/grafana/tasks/main.ymlview raw
---
# for the "docker_data_user_name", or pick your own
- name: Include dockerhost vars
include_vars:
dir: ../../dockerhost/vars

# for the prometheus authentication parameters
- name: Include prometheus vars
include_vars:
dir: ../../prometheus/vars

- name: Include grafana vars
include_vars:
dir: vars

- name: Ensure grafana directories
file:
name: "{{ item }}"
state: directory
owner: "{{ docker_data_user_name }}"
group: "{{ docker_data_user_name }}"
loop:
- "{{ grafana_data_directory }}"
- "{{ grafana_config_directory }}"

- name: Ensure grafana config directories
file:
name: "{{ item }}"
state: directory
owner: "{{ docker_data_user_name }}"
group: "{{ docker_data_user_name }}"
loop:
- "{{ grafana_config_directory }}/provisioning/access-control"
- "{{ grafana_config_directory }}/provisioning/dashboards"
- "{{ grafana_config_directory }}/provisioning/datasources"
- "{{ grafana_config_directory }}/provisioning/notifiers"
- "{{ grafana_config_directory }}/provisioning/plugins"

- name: Copy grafana config
template:
src: files/grafana.ini
dest: "{{ grafana_config_directory }}/grafana.ini"
register: copy_grafana_configuration

- name: Copy grafana datasources
template:
src: "files/datasources/{{ item }}"
dest: "{{ grafana_config_directory }}/provisioning/datasources/{{ item }}"
loop:
- prometheus.yml
register: copy_grafana_datasources

- name: Ensure grafana container
docker_container:
name: grafana
image: grafana/grafana:8.2.6
networks:
- name: internal
networks_cli_compatible: yes
volumes:
- "{{ grafana_data_directory }}:/var/lib/grafana"
- "{{ grafana_config_directory }}:/etc/grafana"
user: "{{ docker_data_uid }}:{{ docker_data_uid }}"
restart_policy: unless-stopped
restart: "{{ copy_grafana_configuration.changed or copy_grafana_datasources.changed }}"
labels:
# Traefik will use these labels to route the service on HTTPS
traefik.http.middlewares.grafana-prefix.stripprefix.prefixes: "/grafana"
traefik.http.routers.grafana.rule: "Host(`{{ ansible_host }}`) && PathPrefix(`/grafana`)"
traefik.http.routers.grafana.entrypoints: "websecure"
# use Let's Encrypt certificates of course
traefik.http.routers.grafana.tls.certresolver: letsEncryptResolver
traefik.http.routers.grafana.tls: "true"
traefik.http.routers.grafana.middlewares: "grafana-prefix,grafana-compression"
traefik.http.services.grafana.loadbalancer.server.port: "3000"
traefik.http.middlewares.grafana-compression.compress: "true"
...

And this is the datasource file. It simply contains the Prometheus URL and auth information along with some preferences.

roles/grafana/files/datasources/prometheus.ymlview raw
---
apiVersion: 1
datasources:
- name: Prometheus
type: prometheus
# we will get 'ansible_host' from our hosts file
url: https://{{ ansible_host }}/prometheus
# pick one
orgId: 1
# might be different for you
isDefault: true
editable: false
# Grafana fetches Prometheus metrics and sends them to the user
access: proxy
basicAuth: true
# we know these because we inluded the prometheus vars directory
basicAuthUser: {{ prometheus_basic_auth_username }}
jsonData:
tlsAuthWithCACert: true
secureJsonData:
basicAuthPassword: {{ prometheus_basic_auth_password }}
...

That’s it for Grafana. Of course you could also provision one or more dashboards but that’s probably out of scope for this post.

Finishing Touches

There are two files missing from the description above. Also, we can improve the display of metrics in Grafana by relabeling the metrics.

Provision the Jumphost

I assume you will integrate the Prometheus and Grafana roles into your own playbooks. If you don’t have one already, here is mine. It is based on my previous posts on Microsoft Azure VM deployment and how to set up Traefik with Ansible. You might want to tune it to fit your needs.

setup.ymlview raw
---
- name: Provision jumphost
hosts: jumphost
become: yes
roles:
- common
- role: dockerhost
vars:
network_subnet: 172.200.0.0/16
- role: traefik
vars:
published_ports:
- 80:80
- 443:443
- 3100:3100
- 9100:9100
- 9200:9200
entrypoints:
web: ":80"
websecure: ":443"
- prometheus
- grafana
...

Ansible Hosts File

In our scripts we referenced the variable ansible_host several times. We provide that value in our hosts.yml file. The hosts file contains a list of the hosts that we want to configure. In our case, that’s just the jumphost. We do not communicate directly with the scale set Vms, that’s what we have Prometheus for.

hosts.ymlview raw
---
all:
hosts:
jumphost:
ansible_host: sometestapp.northcentralus.cloudapp.azure.com
ansible_port: 22
ansible_user: azureadmin
ansible_ssh_private_key_file: ~/.ssh/id_rsa_azure
children:
...

Add Azure specific labels

Right now prometheus will store the scale set VM metrics just as they come in. Unfortunately the standard values do not include Azure specific information like machine name, resource group name, etc… But Prometheus can add these values to the metrics while scraping them from the VMs.

The following example shows how to add the machine name to each metric scraped from a scale set vm with the label azure_machine_name. Just change your Prometheus configuration file accordingly.

There are more labels available in the Prometheus documentation for azure_sd_config.

- job_name: "scalesetvms"
scheme: http

azure_sd_configs:
- ...
relabel_configs:
- target_label: azure_machine_name
source_labels: [__meta_azure_machine_name]

Conclusion

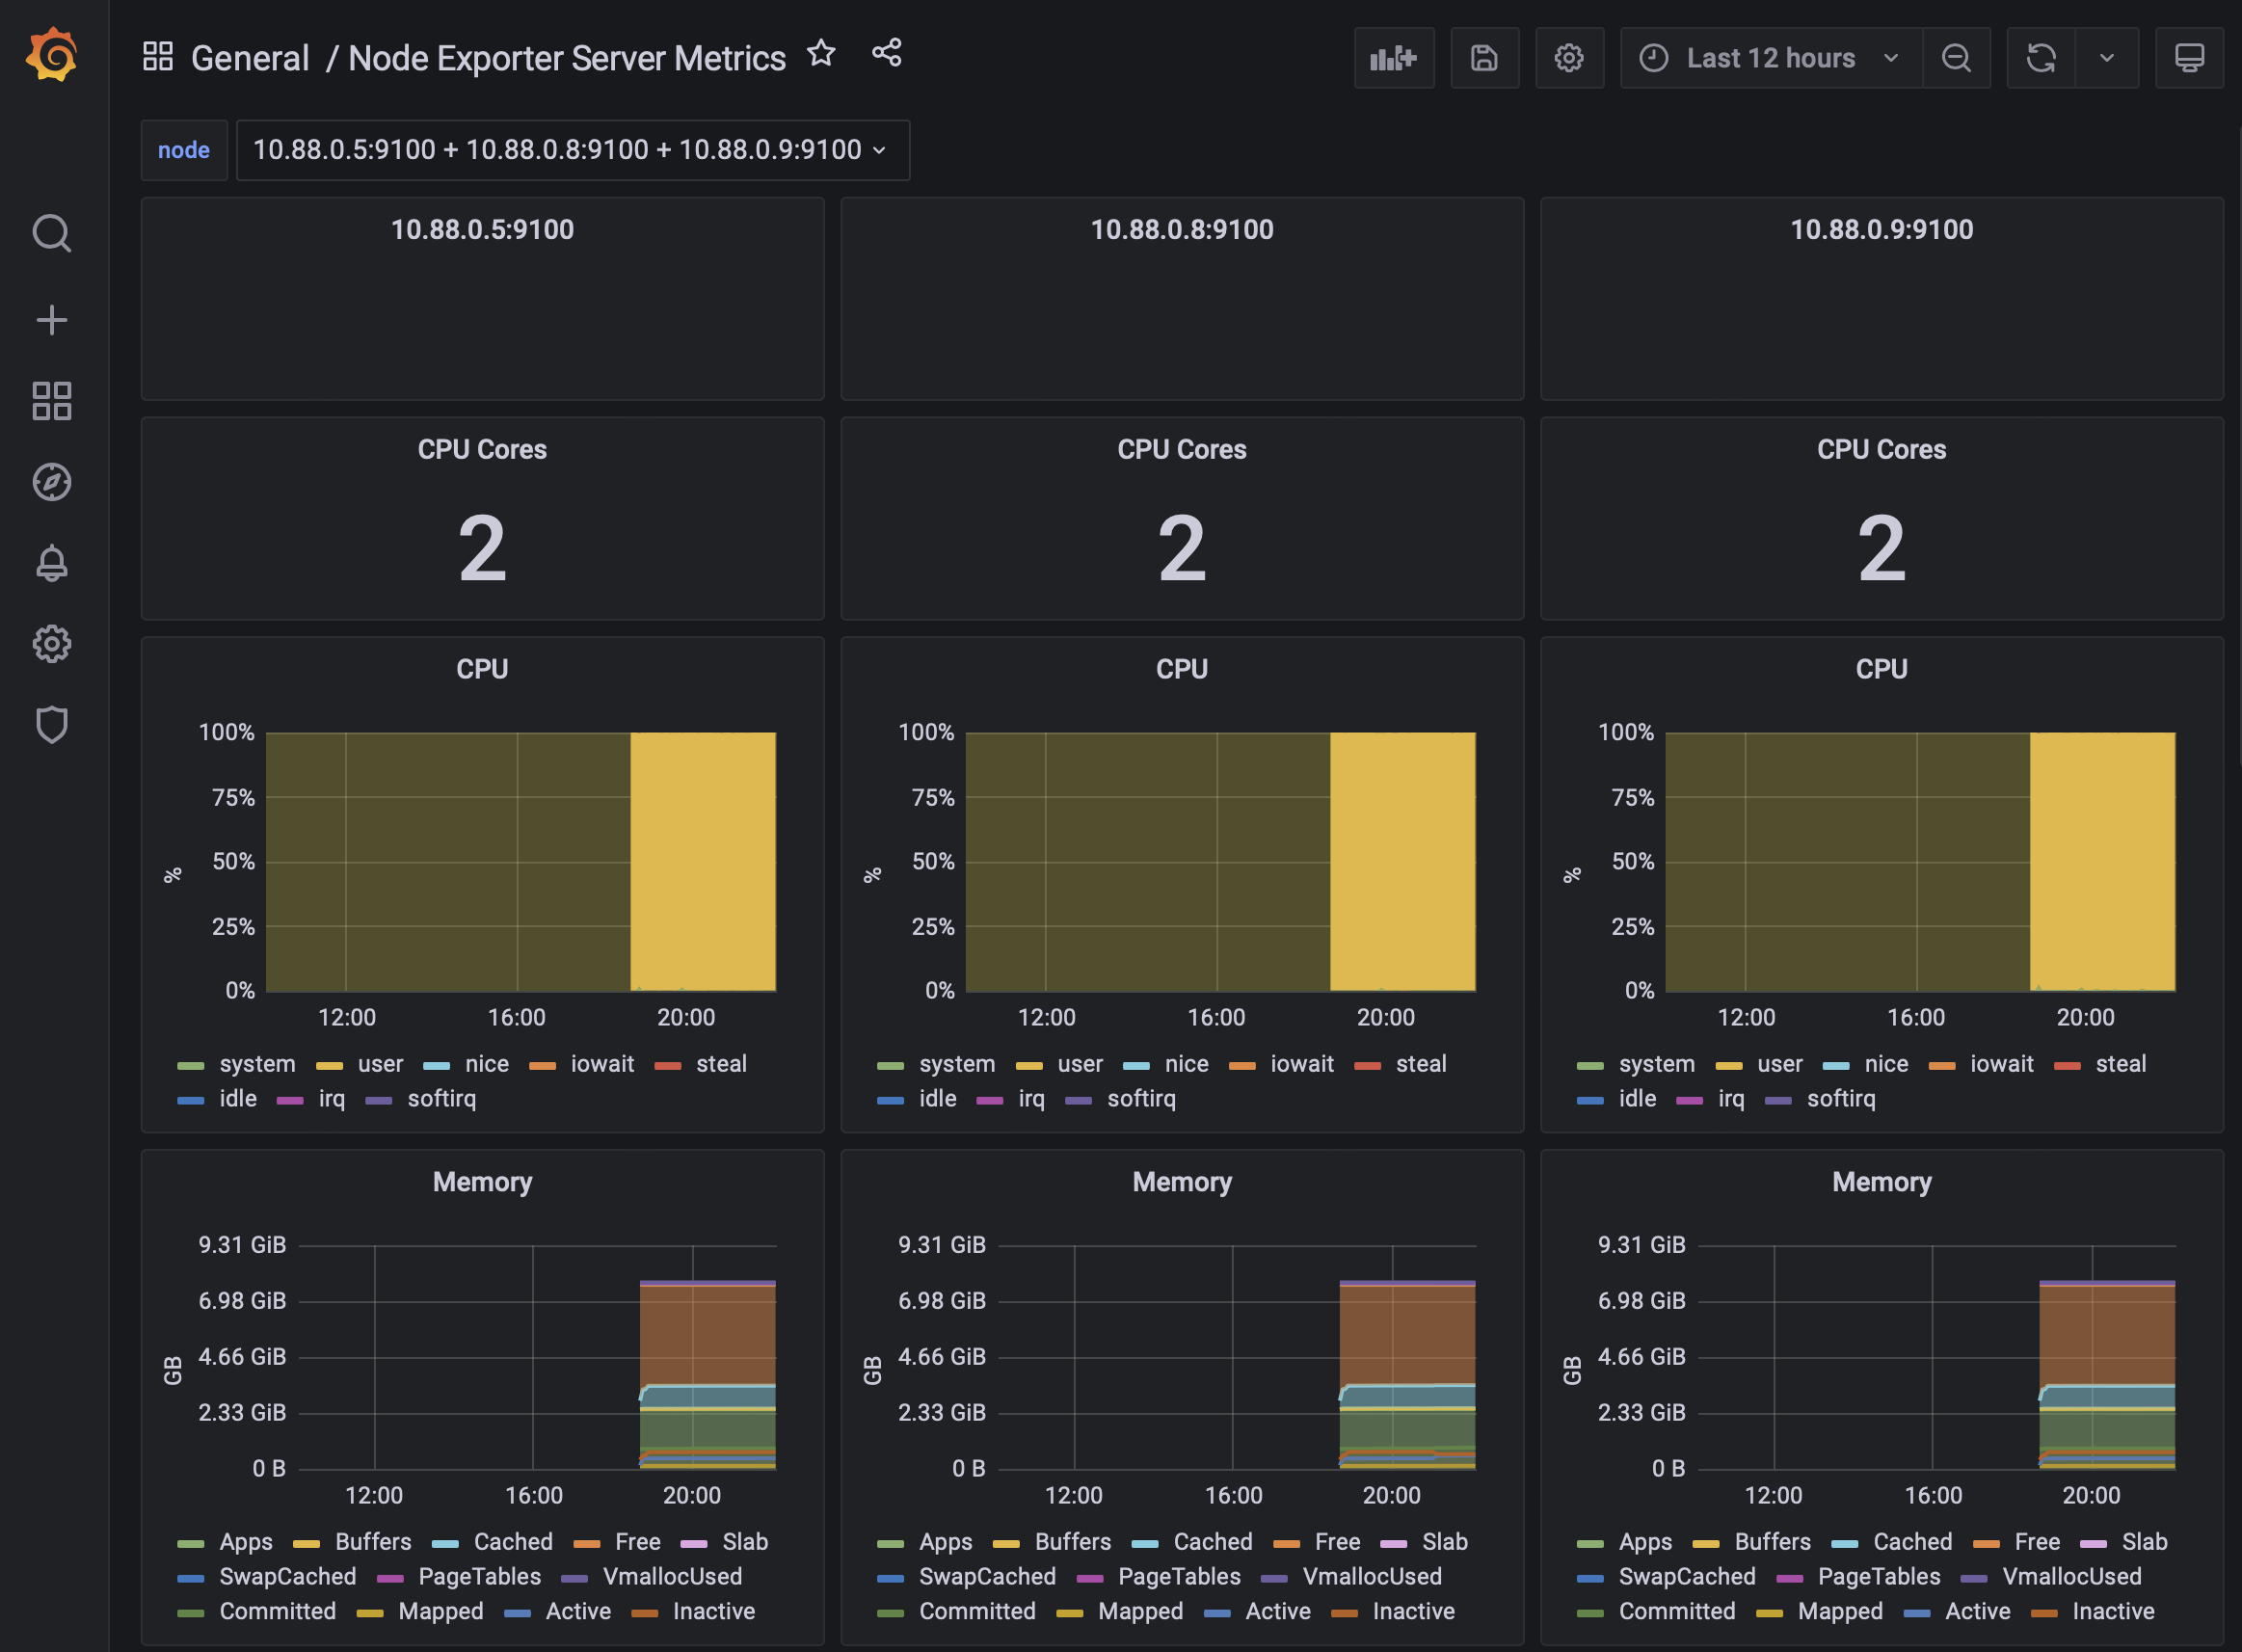
When everything is set up you should have a Grafana instance with a preconfigured datasource fetching from Prometheus. Here an example displaying three VMs running the Microsoft Editor using the Grafana dashboard 405.

Prometheus makes it easy to collect metrics from your Microsoft Azure scale set VMs. The configuration using azure_sd_config may seem a bit “magic”, but it works and adapts to when you add or remove VMs from the scale set.