In the good old days you had one server running your services. When something failed, you logged in via SSH and checked the corresponding log file. Today, most of the time no one server is running all your services. So the log files are distributed over multiple machines and ways of accessing them. From journald, docker logs, over syslog to simple files there are just too many options to check the logs efficiently, especially if you use scale sets on Azure or something equivalent to dynamically adjust the number of VMs to the workload.
Sometimes one solves this problem by introducing an Elasticsearch, Logstash and Kibana (ELK) stack that gathers the logs and makes them searchable. That’s a nice solution, albeit a resource intensive one.

We want to look at a more lightweight alternative: The log aggregator Grafana Loki. Like Elasticsearch it stores logs that are gathered by log shippers like Promtail. You can then display the logs using Grafana.
But unlike Elasticsearch Loki is more lightweight. That’s mostly because it omits the main feature of Elasticsearch: search. Instead, and much more like Prometheus, Loki stores log lines annotated with tags that you can later filter on. So there is no real-time search on log text.
The upside is low hardware requirements. I myself run Loki comfortably on a Raspi 3B where it collects logs from several systems using below 1% CPU at all times. An ELK stack would have serious problems even running on the Raspi 3B, mostly due to the 1GB of system memory.

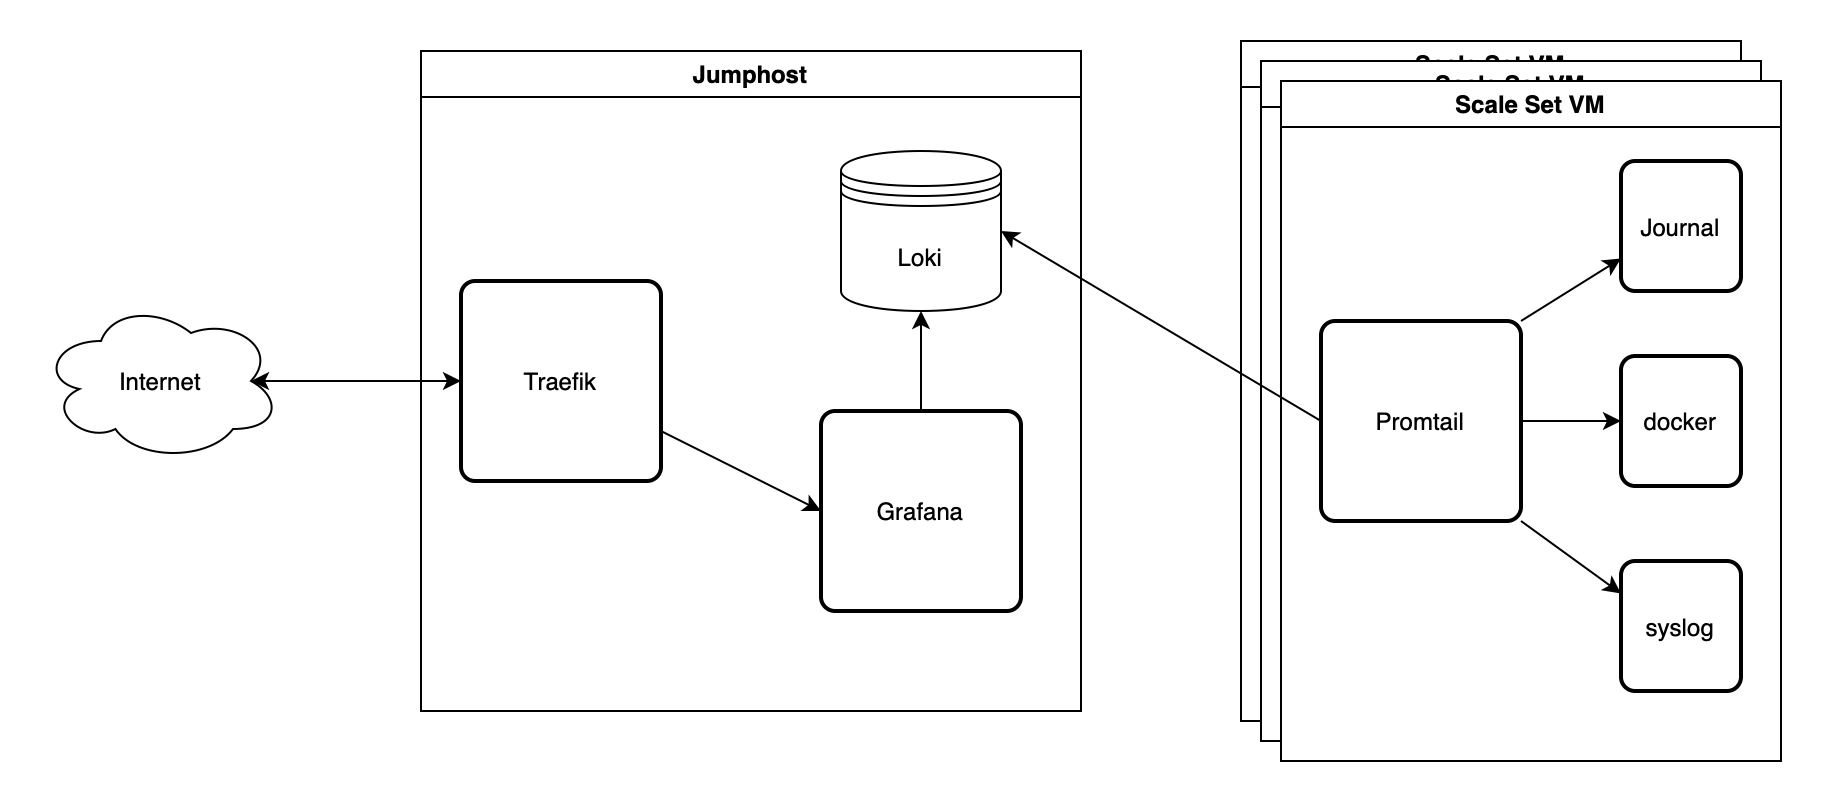
Our example setup runs on Microsoft Azure. A Jumphost runs Loki in a Docker container as well as a Grafana container. We will later visualize our logs with Grafana. We use a Traefik container as reverse proxy that also takes care of SSL. I will not describe the Traefik setup here, but there is a blog post on how to set up Traefik with Ansible. We will use Ansible to deploy the setup. I assume that you have a working development setup with Ansible and Azure. If you need some guidance, there is a post on Microsoft Azure VM deployment with Ansible.
To get some logs we will start an Azure scale set. On each scale set VM a logshipper called Promtail will collect logs from journald and send them to Loki on the jumphost VM.

Collecting Metrics with Grafana Loki

Grafana Loki stores logs and makes them available for visualization. So we don’t really have to configure anything in Loki, just make it available for our VMs and Grafana to access. Our webserver Traefik then adds SSL and basic auth based on the configuration that we put into the labels of the Loki Docker container.

roles/loki/tasks/main.ymlview raw
---
- name: Include loki vars
include_vars:
dir: vars

- name: Ensure directories
file:
name: "{{ item }}"
state: directory
loop:
- "{{ loki_config_directory }}"
- "{{ loki_data_directory }}"

- name: Copy config
template:
src: files/local-config.yaml.j2
dest: "{{ loki_config_directory }}/local-config.yaml"
register: loki_config

- name: Ensure loki container
docker_container:
name: loki
image: grafana/loki:2.5.0
networks:
- name: internal
volumes:
- "{{ loki_config_directory }}:/etc/loki"
- "{{ loki_data_directory }}:/loki"
restart_policy: unless-stopped
restart: "{{ loki_config.changed }}"
labels:
# Traefik will make Loki available on ansible_host:3100 with SSL and basic auth
traefik.http.routers.loki.rule: "Host(`{{ ansible_host }}`)"
traefik.http.routers.loki.entrypoints: "loki"
traefik.http.routers.loki.tls.certresolver: letsEncryptResolver
traefik.http.routers.loki.tls: "true"
traefik.http.routers.loki.middlewares: loki-compression,loki-auth
traefik.http.services.loki.loadbalancer.server.port: "3100"
traefik.http.middlewares.loki-compression.compress: "true"
traefik.http.middlewares.loki-auth.basicauth.users: "{{ loki_basic_auth_username }}:{{ loki_basic_auth_htpassword }}"
traefik.http.middlewares.loki-auth.basicauth.removeheader: "true"
...

We use a near default config file with just the host filled.

roles/loki/files/local-config.yaml.j2view raw
---
auth_enabled: false

server:
http_listen_port: 3100
grpc_listen_port: 9096

common:
path_prefix: /tmp/loki
storage:
filesystem:
chunks_directory: /tmp/loki/chunks
rules_directory: /tmp/loki/rules
replication_factor: 1
ring:
instance_addr: 127.0.0.1
kvstore:
store: inmemory

schema_config:
configs:
- from: 2020-10-24
store: boltdb-shipper
object_store: filesystem
schema: v11
index:
prefix: index_
period: 24h

ruler:
alertmanager_url: http://{{ ansible_host }}:9093
...

We store our variables in the vars/main.yml as always, and the secrets in a vault file that we can encrypt later. This way we can still search for the variables while also be able to safely commit them to a repository.

roles/loki/vars/main.ymlview raw
---
loki_config_directory: /srv/data/loki/config
loki_data_directory: /srv/data/loki/data
loki_basic_auth_username: "{{ vault_loki_basic_auth_username }}"
loki_basic_auth_password: "{{ vault_loki_basic_auth_password }}"
loki_basic_auth_htpassword: "{{ vault_loki_basic_auth_htpassword }}"
...

We store the password for basic auth in the vault so that we can later use it in other recipies. But Traefik reads the password in Apache format. You can create a string like this:

htpasswd -n lokiuser
# then enter the password, you will get something like this:
lokiuser:$apr1$uWyPQU4W$qO9F.2Sx2e2p/eNvm7exp.
# everything after the ":" is the encrypted password that Traefik needs

Our vault file then looks like this:

roles/loki/vars/vault.ymlview raw
---
vault_loki_basic_auth_username: lokiuser
# you should seriously change this password
vault_loki_basic_auth_password: bar
vault_loki_basic_auth_htpassword: $apr1$uWyPQU4W$qO9F.2Sx2e2p/eNvm7exp.
...

Export Logs from Scale Set VMs

Loki relies on other apps called ‘clients’ to collect logs from various sources and push them to Loki via an HTTP API. There are several clients available. In our example we will use Promtail. Promtail can read logs from various sources like files, Kubernetes, Docker, etc….

Prepare an Azure Image with Grafana Promtail

Like in Monero Mining on Azure we use Packer to build and store an image on Microsoft Azure. Check out their tutorials page for further documentation. Our demo image will be rather minimal and do nothing except collecting and exporting logs.
There is no Promtail package in the Ubuntu sources so we manually download Promtail and install the binary including our config file and systemd unit file.

images/azure/promtail-image.pkr.hclview raw
# import the Azure credentials from the environment (export them before building the image)
variable "azure_client_id" {
default = env("AZURE_CLIENT_ID")
}

variable "azure_subscription_id" {
default = env("AZURE_SUBSCRIPTION_ID")
}

variable "azure_secret" {
default = env("AZURE_SECRET")
}

packer {
required_plugins {
azure = {
version = ">= 1.0.0"
source = "github.com/hashicorp/azure"
}
}
}

source "azure-arm" "promtail" {
client_id = "${var.azure_client_id}"
subscription_id = "${var.azure_subscription_id}"
client_secret = "${var.azure_secret}"

managed_image_resource_group_name = "tnglab"
managed_image_name = "promtail"

os_type = "Linux"
image_publisher = "Canonical"
image_offer = "0001-com-ubuntu-server-impish"
image_sku = "21_10-gen2"

location = "North Central US"
vm_size = "Standard_B2s"
}

build {
name = "promtail-build"
sources = [
"source.azure-arm.promtail"
]

provisioner "file" {
source = "config.yaml"
destination = "/tmp/promtail-config.yaml"
}

provisioner "file" {
source = "../../roles/promtail/files/promtail.service"
destination = "/tmp/promtail.service"
}


provisioner "shell" {
environment_vars = [
]
inline = [
# the Ubuntu cloud image does some magic on boot. Wait for that to finish
"cloud-init status --wait",
"sudo apt update",
"sudo apt upgrade -y",
"sudo apt install -y zip unzip",
# download promtail
"wget https://github.com/grafana/loki/releases/download/v2.5.0/promtail-linux-amd64.zip",
"unzip promtail-linux-amd64.zip",
# move the promtail binary into user bin directory
"sudo mv promtail-linux-amd64 /usr/local/bin/promtail && sudo chmod 755 /usr/local/bin/promtail",
# move our config file into the right directory
"sudo mkdir -p /etc/promtail",
"sudo mv /tmp/promtail-config.yaml /etc/promtail/config.yaml",
"sudo mv /tmp/promtail.service /etc/systemd/system/promtail.service",
# enable the promtail service. We don't have to start it, we are only building the image here
"sudo systemctl enable promtail.service"
]
}
}

In the config we specify the URL to the Loki container. Promtail will then push the collected logs through the Loki HTTP API. Traefik protects Loki with basic auth so we have to fill the username and password in the Promtail config, too. Of course Promtail can’t access the Ansible vault so we will fill these values when building the image using a separate Ansible playbook.
However, Promtail can use environment variables in its config file and we use that here to add a tag to the labels with the $HOSTNAME of the system running promtail. We can use it later to identify the machine.

roles/promtail/files/config.yamlview raw
---
server:
disable: true

positions:
filename: /tmp/positions.yaml

clients:
- url: https://{{ ansible_host }}:3100/loki/api/v1/push
basic_auth:
username: {{ loki_basic_auth_username }}
password: {{ loki_basic_auth_password }}

scrape_configs:
- job_name: journal
journal:
json: false
max_age: 12h
path: /var/log/journal
labels:
job: systemd-journal
node: ${HOSTNAME}
relabel_configs:
- source_labels: ['__journal__systemd_unit']
target_label: 'unit'
...

Unfortunately systemd will not provide the environment variable $HOSTNAME in the default configuration. It should do that and you should also be able to define further environment variables for your service in the systemd unit file but none of these ways worked for me. As a last resort I wrapped the promtail call in a bash call because bash will evaluate hostname correctly.

roles/promtail/files/promtail.serviceview raw
[Unit]
Description = promtail logshipper

[Service]
ExecStart = /bin/bash -c "HOSTNAME=$(hostname) /usr/local/bin/promtail -config.file=/etc/promtail/config.yaml -config.expand-env=true"

[Install]
WantedBy=multi-user.target

As mentioned above we need Ansible to render a config file for Promtail with the authentication data from the Ansible vaults before building the image. So here is a short playbook that does exactly that. Note that you have to manually overwrite the ansible_host variable. Otherwise that would resolve to localhost because that’s where you render the config template.

build-azure-image.ymlview raw
---
- name: Build Azure Promtail image
hosts: localhost
gather_facts: no
connection: local
tasks:
- name: Include loki vars
include_vars:
dir: roles/loki/vars
- name: Build promtail config file
template:
src: roles/promtail/files/config.yaml
dest: images/azure/config.yaml
vars:
ansible_host: "{{ hostvars['jumphost'].ansible_host }}"
- name: Build azure image
ansible.builtin.command: packer build -force promtail-image.pkr.hcl
args:
chdir: images/azure
- name: Remove rendered config file
file:
name: images/azure/config.yaml
state: absent
...

Start a Microsoft Azure Scale Set with Ansible

You can start an Azure Scale Set with just one ansible task if you already have a resource group, virtual network and subnet. I got a post on how to create your Azure virtual network and subnet.

---
- name: Start Promtail Test VMs on Azure
hosts: localhost
gather_facts: no
connection: local
tasks:
- name: Ensure VM scale set
azure_rm_virtualmachinescaleset:
name: tnglab-node-promtails
resource_group: tnglab
# Pick your chosen size
vm_size: Standard_D2as_v4
# How many VMs you want in the scale set
capacity: 3
virtual_network_name: tnglab-vnet
subnet_name: tnglab-subnet
upgrade_policy: Manual
admin_username: azureadmin
ssh_password_enabled: no
ssh_public_keys:
- path: /home/azureadmin/.ssh/authorized_keys
key_data: ssh-rsa AAAA... benjamin@tnglab
managed_disk_type: Standard_LRS
# Here we reference our image from above
image:
name: promtail
resource_group: tnglab
...

Now you have some VMs running in the cloud, exporting logs to Loki.

Provision Grafana Datasources

We could manually add the Loki container as a datasource in Grafana, but this is not the way. Instead we provision the Loki datasource when we set up Grafana. That won’t require huge changes. We just have to copy a configuration file to the right directory.

Our Grafana ansible task then sets up the config directories, copies the config files and starts the grafana container:

roles/grafana/tasks/main.ymlview raw
---
# for the "docker_data_user_name", or pick your own
- name: Include dockerhost vars
include_vars:
dir: ../../dockerhost/vars

# for the prometheus authentication parameters
- name: Include prometheus vars
include_vars:
dir: ../../prometheus/vars

- name: Include grafana vars
include_vars:
dir: vars

- name: Ensure grafana directories
file:
name: "{{ item }}"
state: directory
owner: "{{ docker_data_user_name }}"
group: "{{ docker_data_user_name }}"
loop:
- "{{ grafana_data_directory }}"
- "{{ grafana_config_directory }}"

- name: Ensure grafana config directories
file:
name: "{{ item }}"
state: directory
owner: "{{ docker_data_user_name }}"
group: "{{ docker_data_user_name }}"
loop:
- "{{ grafana_config_directory }}/provisioning/access-control"
- "{{ grafana_config_directory }}/provisioning/dashboards"
- "{{ grafana_config_directory }}/provisioning/datasources"
- "{{ grafana_config_directory }}/provisioning/notifiers"
- "{{ grafana_config_directory }}/provisioning/plugins"

- name: Copy grafana config
template:
src: files/grafana.ini
dest: "{{ grafana_config_directory }}/grafana.ini"
register: copy_grafana_configuration

- name: Copy grafana datasources
template:
src: "files/datasources/{{ item }}"
dest: "{{ grafana_config_directory }}/provisioning/datasources/{{ item }}"
loop:
- loki.yml
register: copy_grafana_datasources

- name: Ensure grafana container
docker_container:
name: grafana
image: grafana/grafana:8.2.6
networks:
- name: internal
networks_cli_compatible: yes
volumes:
- "{{ grafana_data_directory }}:/var/lib/grafana"
- "{{ grafana_config_directory }}:/etc/grafana"
user: "{{ docker_data_uid }}:{{ docker_data_uid }}"
restart_policy: unless-stopped
restart: "{{ copy_grafana_configuration.changed or copy_grafana_datasources.changed }}"
labels:
# Traefik will use these labels to route the service on HTTPS
traefik.http.middlewares.grafana-prefix.stripprefix.prefixes: "/grafana"
traefik.http.routers.grafana.rule: "Host(`{{ ansible_host }}`) && PathPrefix(`/grafana`)"
traefik.http.routers.grafana.entrypoints: "websecure"
# use Let's Encrypt certificates of course
traefik.http.routers.grafana.tls.certresolver: letsEncryptResolver
traefik.http.routers.grafana.tls: "true"
traefik.http.routers.grafana.middlewares: "grafana-prefix,grafana-compression"
traefik.http.services.grafana.loadbalancer.server.port: "3000"
traefik.http.middlewares.grafana-compression.compress: "true"
...

And this is the datasource file. It simply contains the Loki URL and auth information along with some preferences.

roles/grafana/files/datasources/loki.ymlview raw
---
apiVersion: 1
datasources:
- name: Loki
type: loki
url: https://{{ ansible_host }}:3100
orgID: 2
isDefault: false
editable: false
access: proxy
basicAuth: true
basicAuthUser: {{ prometheus_basic_auth_username }}
jsonData:
tlsAuthWithCACert: true
secureJsonData:
basicAuthPassword: {{ prometheus_basic_auth_password }}
...

That’s it for Grafana. Of course you could also provision one or more dashboards but that’s probably out of scope for this post.

Finishing Touches

Provision the Jumphost

I assume you will integrate the Prometheus and Grafana roles into your own playbooks. If you don’t have one already, here is mine. It is based on my previous posts on Microsoft Azure VM deployment and how to set up Traefik with Ansible. You might want to tune it to fit your needs.

setup.ymlview raw
---
- name: Provision jumphost
hosts: jumphost
become: yes
roles:
- common
- role: dockerhost
vars:
network_subnet: 172.200.0.0/16
- role: traefik
vars:
published_ports:
- 80:80
- 443:443
- 3100:3100
- 9100:9100
- 9200:9200
entrypoints:
web: ":80"
websecure: ":443"
- loki
- grafana
...

Ansible Hosts File

In our scripts we referenced the variable ansible_host several times. We provide that value in our hosts.yml file. The hosts file contains a list of the hosts that we want to configure. In our case, that’s just the jumphost. We do not communicate directly with the scale set Vms, that’s what we have Prometheus for.

hosts.ymlview raw
---
all:
hosts:
jumphost:
ansible_host: sometestapp.northcentralus.cloudapp.azure.com
ansible_port: 22
ansible_user: azureadmin
ansible_ssh_private_key_file: ~/.ssh/id_rsa_azure
children:
...

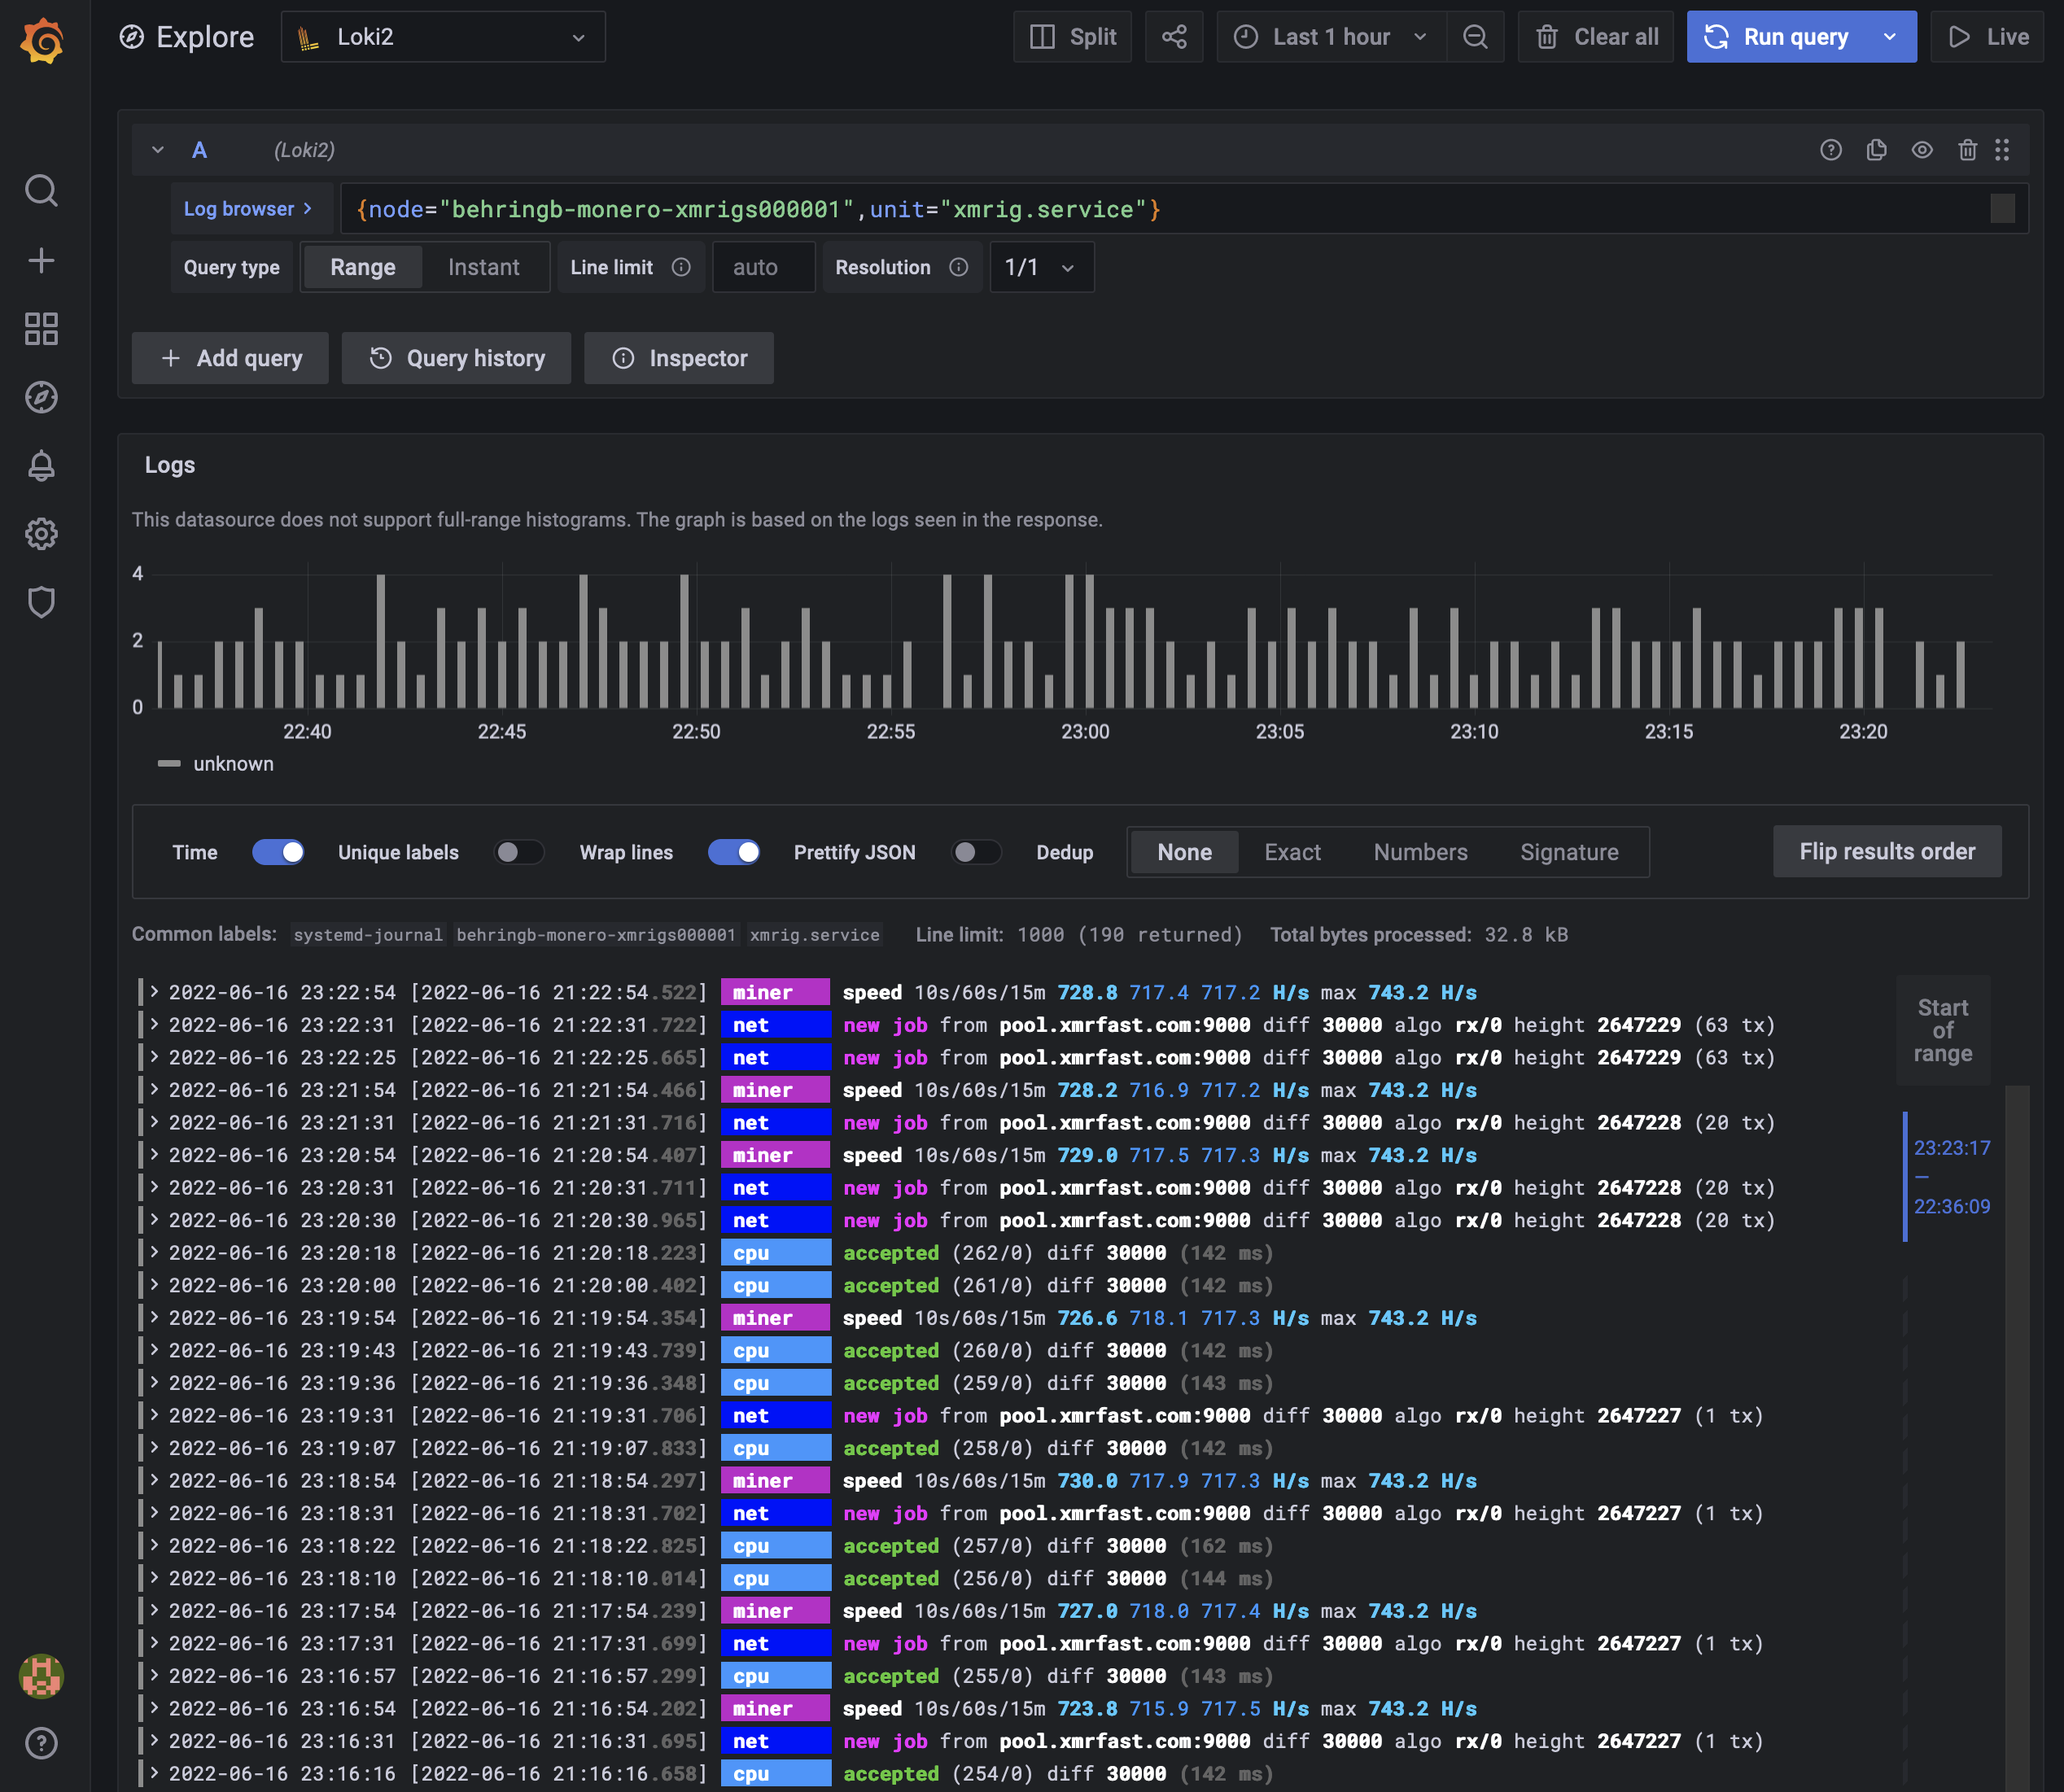
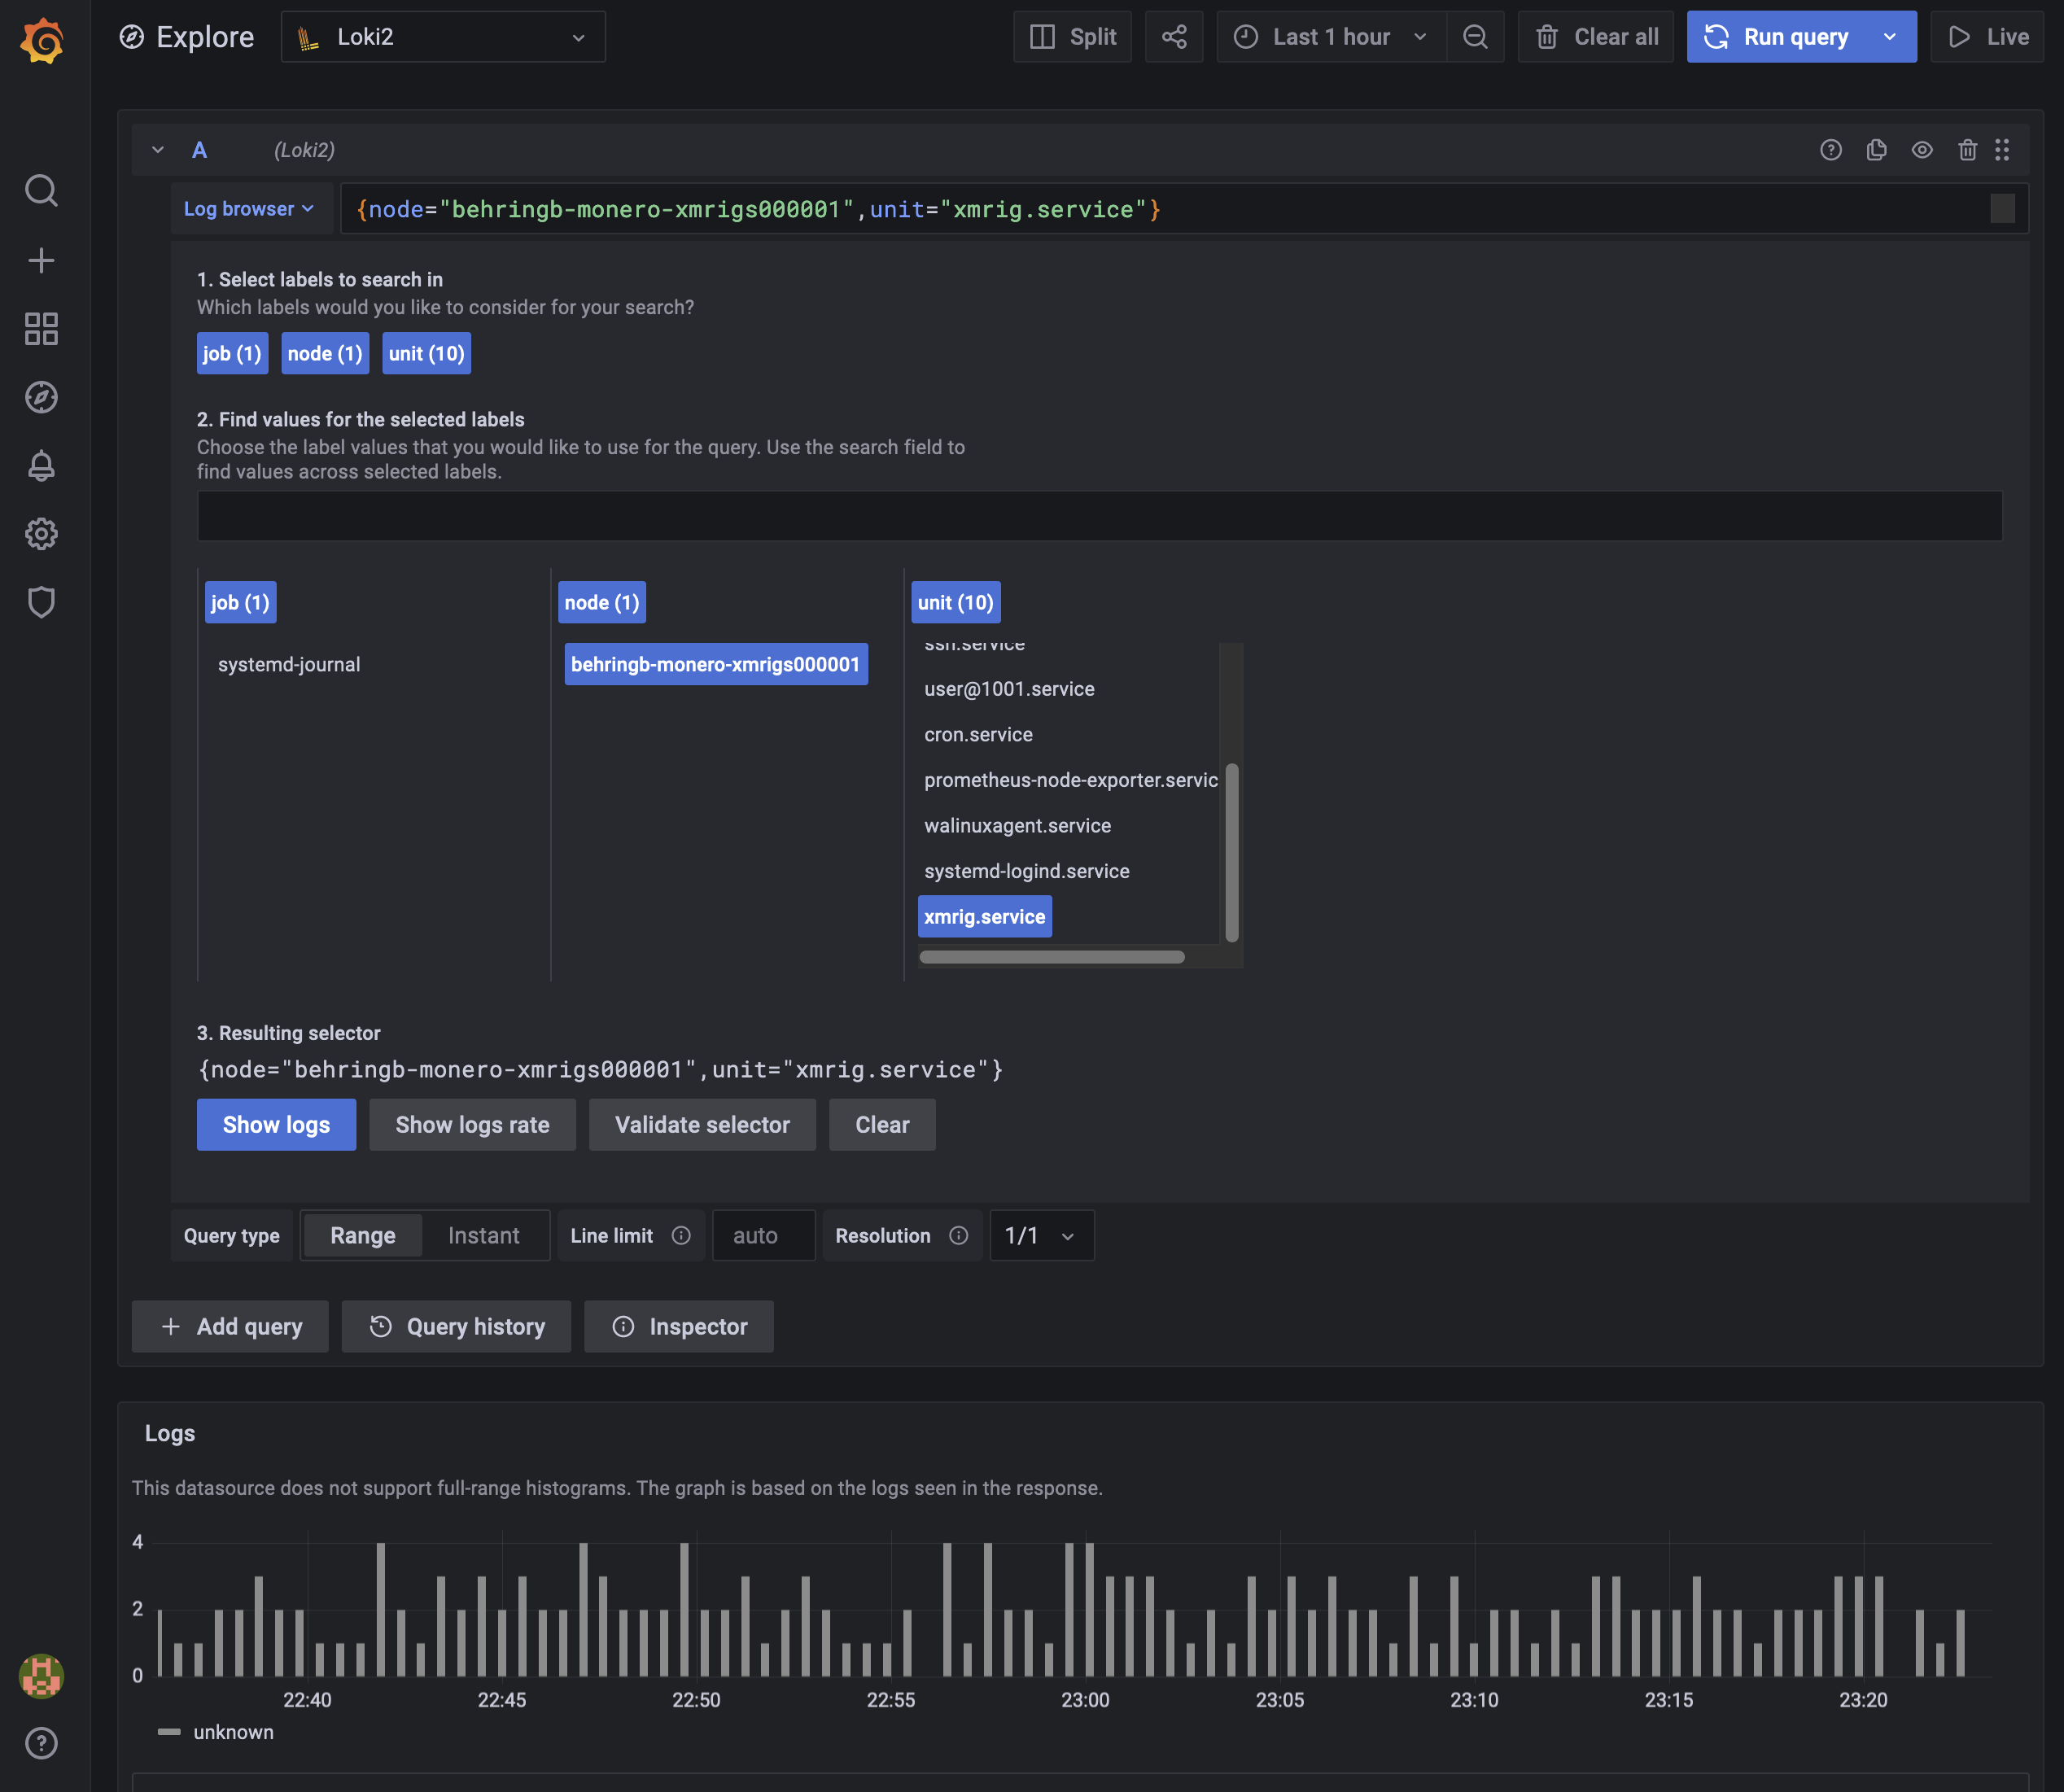
Digging through logs in Grafana

To dig through the logs open Grafana and select the Explore section on the left menu bar. Then select Loki as datasource at the top and click “Log Browser” in the first query. Now you should see a list of tags like job, hostname and unit. Select the values that match the logs that you are looking for and click “Show Logs”. Now you can scroll through the collected logs. Adjust your timeframe in the upper right corner.

Conclusion

Grafana Loki is a lightweight alternative to other log aggregation stacks like ELK. Loki does not offer full text search like Elasticsearch but you can filter your logs by tags. I bave been using Loki for a while now on a Raspi 3B without any problems. I don’t miss the more advanced features of Elasticsearch and appreciate that I can run it 24/7 on very weak hardware. If you can live without full text search or other Elasticsearch features, I guess it’s worth trying out.